Quick facts
Please note that all information refers to England only unless otherwise stated.
You can find explanations of technical terms such as financial support, fair access, student success and progression in our online Glossary.
Briefing on fair access – progress made and remaining challenges
To print or export this briefing, open it in full screen view and then use the “…” menu in the top right hand corner.
Access agreements: summary statistics
This information is drawn from English universities’ and colleges’ access agreements.
Number of access agreements
| Academic year of access agreements | Number of higher education institutions with access agreements | Number of further education colleges with access agreements | Total number of access agreements |
|---|---|---|---|
| 2017-18 (current academic year) | 123 | 75 | 198 |
| 2018-19 (next academic year) | 123 | 84 | 207 |
Tuition fees charged by English universities and colleges
2017-18 access agreements (current academic year)
For students studying in the academic year 2017-18:
- the average full-time fee is predicted to be £8,996, which will reduce to £8,977 after fee waivers
- 134 universities or colleges (68 per cent of those with access agreements) plan to charge a maximum fee of £9,250 for at least one of their courses
- 36 universities or colleges (18 per cent of those with access agreements) plan to charge £9,250 for all their courses.
For more details, including a breakdown of fees at each university or college with an access agreement, see OFFA publication 2016/07, 2017-18 access agreements: institutional expenditure and fee levels.
2018-19 access agreements (next academic year)
For students studying in the academic year 2018-19:
- the average full-time fee is predicted to be £9,012, which will reduce to £9,001 after fee waivers
- 135 universities or colleges (65 per cent of those with access agreements) plan to charge a maximum fee of £9,250 for at least one of their courses
- 26 universities or colleges (13 per cent of those with access agreements) plan to charge £9,250 for all their courses.
For more details, including a breakdown of provisional fees at each university or college with an access agreement, see OFFA publication 2017/08, Access agreements 2018-19: key statistics and analysis (revised).
How much money do universities and colleges spend under their access agreements?
This chart shows actual investment by universities and colleges monitored by OFFA up to and including academic year 2015-16 (the most recent round of monitoring that we have completed), and future investment that universities and colleges have told us they plan to make in academic years 2016-17 and beyond.
Please note that access agreement expenditure is not the only funding that universities and colleges commit to widening participation and improving access; their total investment towards these aims may be higher than shown in this chart.
Access agreement investment (excluding Government contribution to National Scholarship Programme), 2011-12 to 2019-20
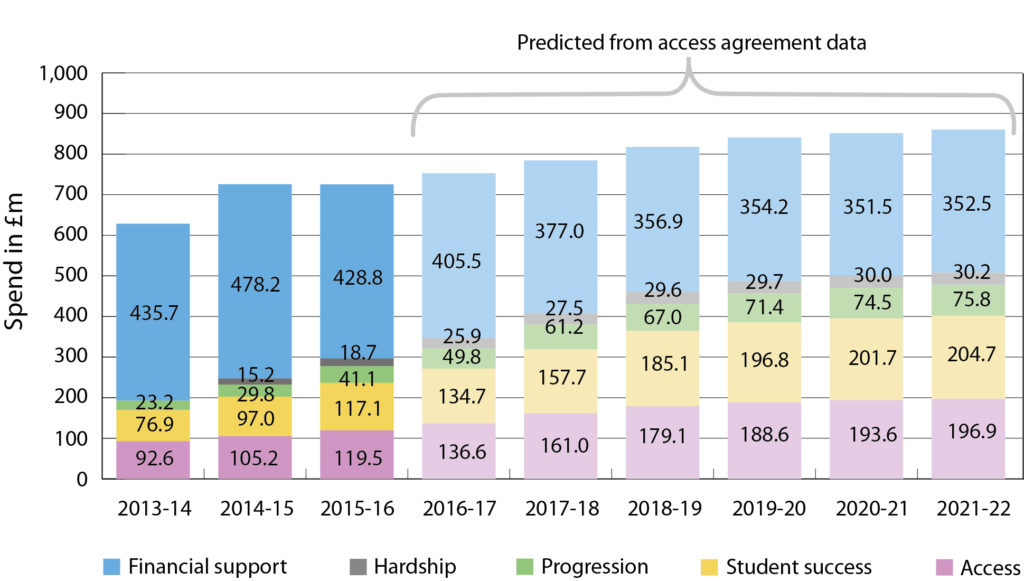
In the academic year 2015-16 (the most recent year for which we have data on actual investment), universities and colleges spent £725.2 million on access measures under their access agreements. This represents 27.4 per cent of their income from fees above the basic level.
Of this, they spent:
- £119.5 million on outreach activities for people with the potential to succeed in higher education (e.g. forming and sustaining links with communities and employers; mentoring to help potential students improve their GCSE and A level grades; or summer schools offering a taste of university life to children who may not have a family background in higher education)
- £117.1 million on student success activities to help students stay on course and achieve their full potential (e.g. induction programmes to help students settle into university life; pastoral and study skills support; or mentoring to improve employability)
- £41.1 million on progression activities to support disadvantaged students as they prepare to go on to their chosen career or postgraduate study (e.g. internships; help with interview skills; or mentoring by graduates involved in the professions)
- £447.5 million on financial support, of which:
- £428.8 million on bursaries, scholarships and fee waivers (discounts) for lower income students and other under-represented groups. The vast majority of this money (87 per cent) went to the poorest students i.e. those with a household income under £25,000
- £18.7 million on hardship funds for students experiencing severe financial difficulties.
For more details of past investment see OFFA publication 2017/02, Outcomes of access agreement monitoring for 2015-16, or download our monitoring outcomes tool [MS Excel].
For more details of planned future investment, including individual institutions’ predicted spending, see OFFA publication 2017/06, Access agreements 2018-19: key statistics and analysis.